Bitcoins: Is It Too Late to Invest?

Summary: The price of Bitcoin has nearly doubled since November, going from $15.6K to over $30K. This growth has outperformed the S&P 500 (+17%) and NASDAQ (+38%) during the same period. This article explores why Bitcoin still has significant potential for growth, considering its total market cap is currently only about 1/20th of that of gold. Notably, several asset managers, such as Fidelity and BlackRock, are seeking approval for spot Bitcoin ETFs, which could potentially result in billions of dollars flowing into the digital asset. Additionally, we examine past Bitcoin cycles using on-chain analysis and data to determine where the current market stands.
Are We Bullish on BTC in the Long Term?
BTC is considered to be the digital equivalent of gold and a reliable store of value due to its capped maximum supply of 21 million. In comparison to physical gold, BTC offers the advantage of swift global transfers and resistance to censorship. Furthermore, unless the Internet infrastructure is severely compromised, BTC’s self-custody feature arguably provides enhanced security compared to gold. The scarcity and security of BTC position it as a potential hedge against inflation in today’s monetary system, where governments often engage in excessive money printing.
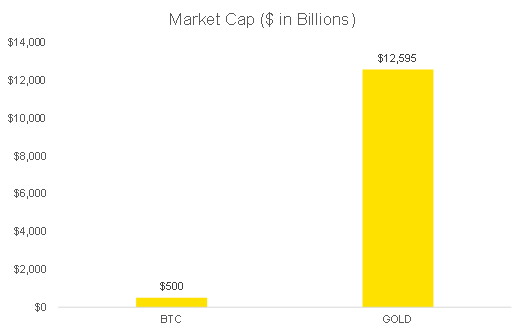
The recent BTC rally following the SVB crisis indicates that investors are increasingly recognizing the value of BTC as a decentralized and transparent asset. For reference, since the US terminated the convertibility of USD to gold in the early 1970s, gold has appreciated approximately 50 times against the USD. At the time of writing, BTC has a market cap of approximately $596 billion, or $644 billion when considering the 21 million maximum supply. In contrast, the estimated market cap of gold stands at $12.7 trillion, roughly 20 times that of BTC, suggesting significant potential for BTC’s long-term growth.
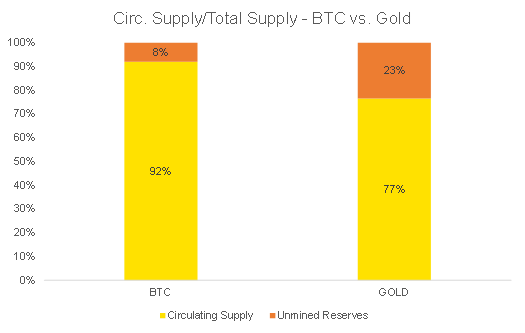
Additionally, one can argue that BTC serves as a superior store of value compared to gold due to the fact that the unmined BTC accounts for approximately 8% of the maximum supply, which is lower than the 23.4% of gold reserves available on Earth.
Figure 1: As a Hedge against Inflation and Money Printing, Gold Price Has Increased throughout History
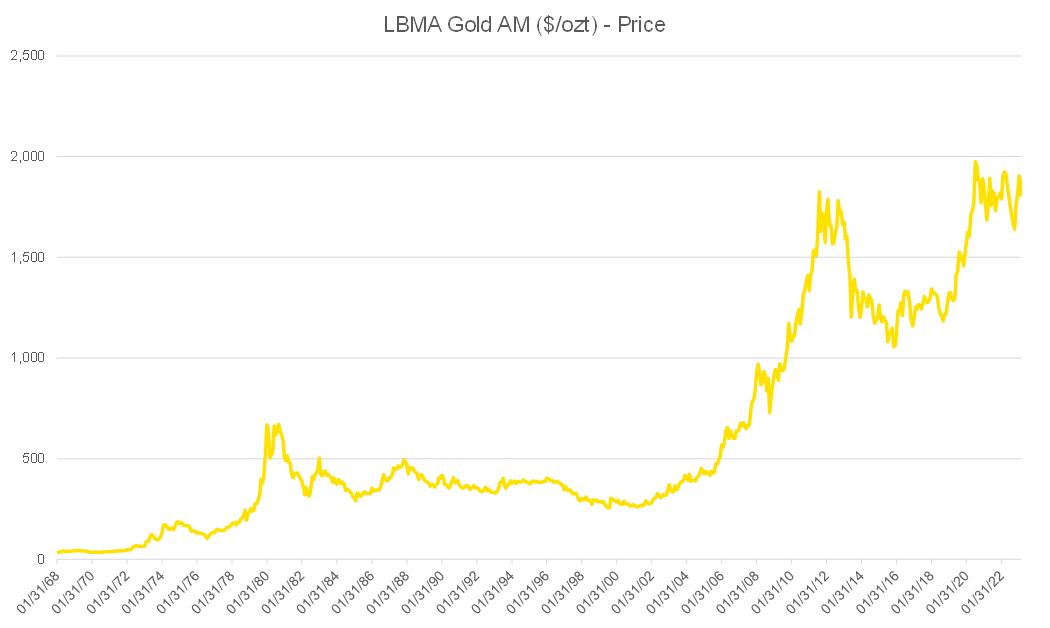
Figure 2: Left: BTC Market Cap vs. Gold Market Cap; Right: BTC and Gold Circulating/Total Supply Comparison
Has a BTC Bull Market Started?
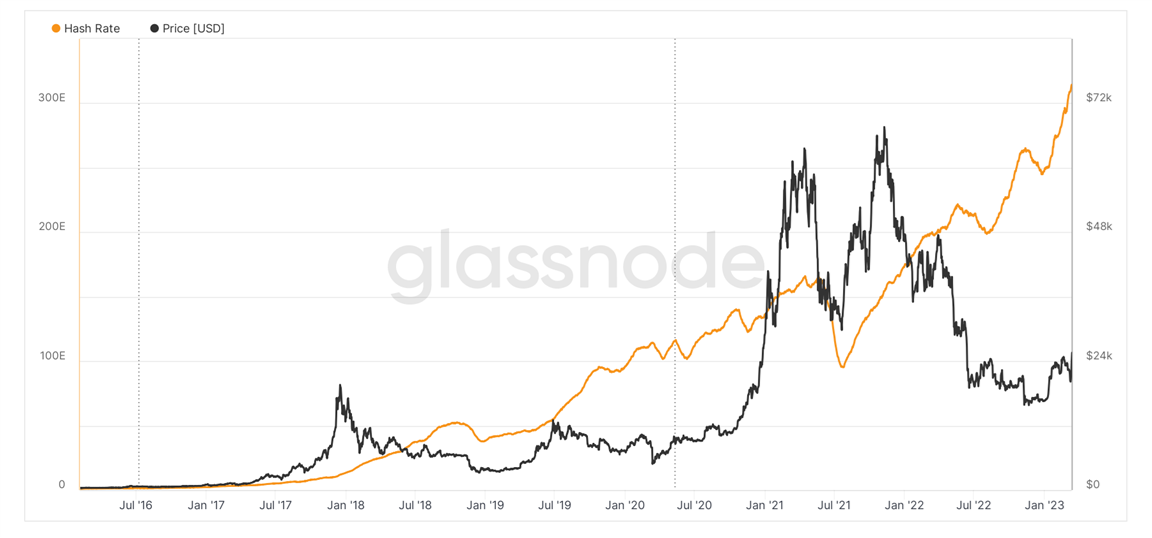
Despite last year’s bear market, BTC’s fundamentals remained robust. Throughout the year, the number of addresses with a non-zero balance increased by 12% from January to December, indicating growing adoption even amidst price declines (see Figure 3). Furthermore, despite a significant price drop of over 77% from November 2021 to November 2022, the network hash rate, which serves as a measure of the BTC network’s computing power and security, nearly doubled during the same period. This indicates that miners maintained their confidence in the technology (see Figure 4).
Figure 3: BTC Adoption Continued to Increase in the Bear Market (30D MA)
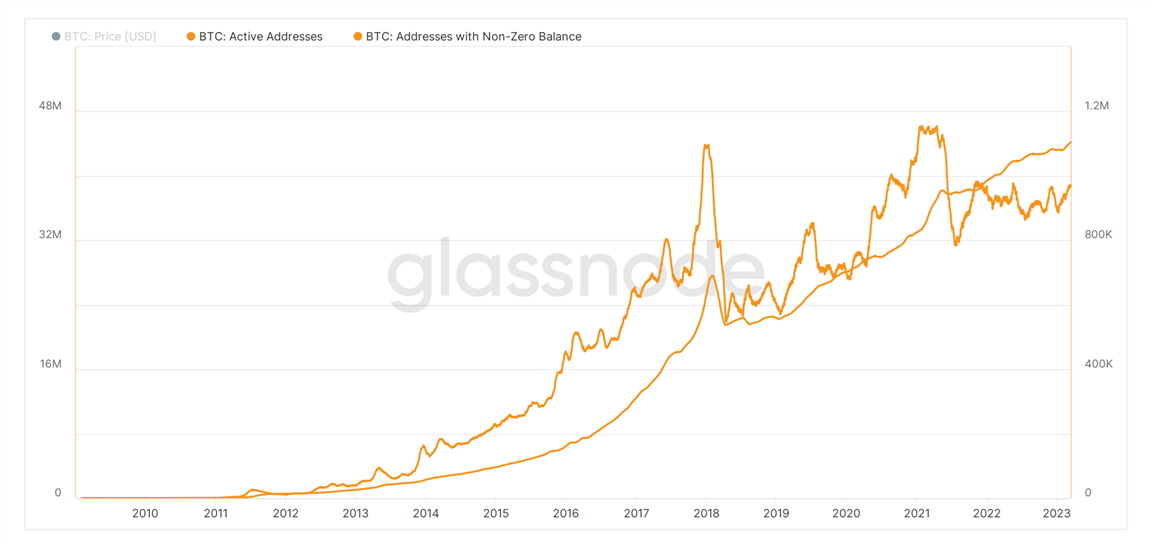
Figure 4: BTC Network Hash Rate Almost Doubled Since the Last ATH (Nov. 2021)
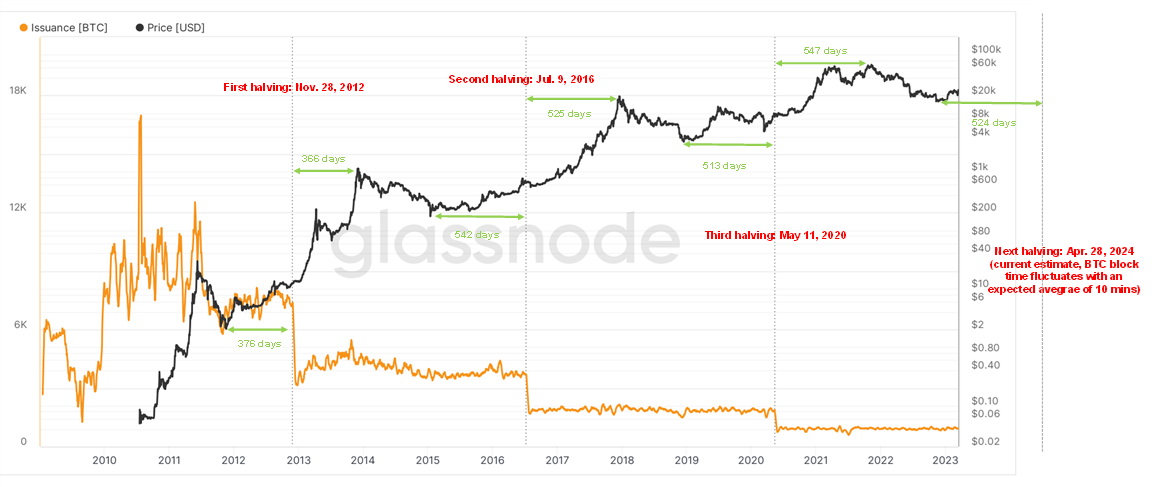
BTC miners receive new BTC as rewards for securing the network through the process of mining. These rewards are programmed to halve every 210,000 blocks, which is approximately every four years. This mechanism gradually reduces the inflation of BTC until the last BTC is mined, projected to occur in 2140. The historical relationship between halving events and BTC price has displayed a consistent and intriguing pattern (refer to Figure 5). Specifically, in each cycle, the BTC price tended to reach its bottom point around 520 days before the halving event and reached its peak the same number of days afterward. While we primarily consider the past two halvings as they are more relevant due to changes in market structure, the pattern also holds true for the first halving, with the bottom and peak occurring around the same number of days before and after the event.
It is important to note that accurately predicting the next halving date is challenging due to the fluctuating BTC network block time (with a target of 10 minutes per block). Based on current estimates, the next halving is expected to take place on April 28, 2024. Interestingly, the lowest BTC price since the previous all-time high (ATH) occurred on November 21, 2022, which was 524 days before the anticipated next halving date.
While we do not consider the historical pattern as an absolute certainty, we attempt to make sense of it. The halving is generally viewed as a positive catalyst for the BTC price since it reduces the availability of BTC, thus decreasing potential selling pressure (similar to the impact of halved gold production). One can reasonably theorize that after each ATH, investors began to take profits, resulting in more selling pressure than buying. However, as the next positive catalyst (halving) approached, buying pressure increased and eventually surpassed selling pressure, marking the bottom of the cycle. The similar time intervals can be attributed to crowd psychology. This theory holds because BTC has a straightforward and compelling narrative as the new digital gold and a reliable store of value. In contrast, traditional assets like stocks, bonds, and commodities are subject to external factors such as competition, accounting issues, supply chain disruptions, regulations, monetary and fiscal policies, and industry cycles.
Figure 5: BTC Halving Events and Price Pattern (BTC Price in Logarithmic Scale)
On-chain profit and loss data also provide support for the notion that the bottom is likely in for BTC and other crypto assets. These profit and loss metrics can be applied to all markets, but the transparency of blockchain technology makes them particularly valuable in assessing the current market condition. Even for readers who are less familiar with blockchain, these metrics are accessible and accurately calculable due to the transparency and immutability of blockchain data.
Realized and unrealized profit and loss data work exceptionally well for BTC because of its straightforward investment narrative and the resulting investor structure. BTC investors can be broadly classified into two categories:
- Experienced long-term investors: These investors have a strong belief in the long-term value of BTC and are willing to hold it for extended periods. They generally possess a better understanding of the technology. Long-term investors do not engage in frequent trading activities. Instead, they tend to sell when they perceive the market as excessively hyped and only buy when others are capitulating.
- Less experienced short-term investors: This group has less faith in BTC but seeks to profit from trading the asset. They often have a limited understanding of the technology but are attracted to the exceptional returns BTC has demonstrated in the past. However, they are more prone to selling when the market experiences declines.
The following outlines how each cycle is influenced by these two types of investors, starting from the bottom:
- Stage 1: At the bottom of a cycle, most short-term investors have lost interest in the asset due to its poor performance over the past year or so. However, long-term investors recognize the buying opportunity and begin accumulating BTC at the bottom. This process is dynamic, and long-term investors do not always time the exact bottom accurately. However, as the price continues to decline, more long-term investors enter the market, contributing to increased buying pressure.
- Stage 2: As the price further declines, a significant number of long-term investors identify this as the bottom and begin buying BTC, resulting in buying pressure surpassing selling pressure. Consequently, the BTC price stabilizes. Over time, short sellers eventually give up, leading to a rise in BTC price. At this stage, most short-term investors remain skeptical about the sustainability of the rally and refrain from participating.
- Stage 3: BTC price continues to rise as long-term investors continue buying, and short-term investors reenter the market, further driving the price up. A bull market commences, attracting more short-term or new investors, thereby initiating a positive feedback loop.
- Stage 4: BTC price continues to climb until long-term investors perceive the market as hyped and begin taking profits, contributing to increased selling pressure. The cycle reaches its peak when selling pressure exceeds buying pressure.
- Stage 5: As more long-term investors sell and take profits, the market starts to decline, and short-term investors follow suit until most short-term investors capitulate. At this point, a new bottom is established, and the market reverts back to stage 1.
It’s important to note that these observations are based on historical patterns and general trends, and they do not guarantee future outcomes. Market dynamics can be influenced by various factors, and individual cycles may exhibit variations.
According to this framework, identifying the bottom requires recognizing the point at which most short-term investors have capitulated and long-term investors begin buying. On-chain profit and loss data play a crucial role in this assessment. In Figures 6 and 7, we present different on-chain profit and loss metrics to support the argument that the bottom is likely in (November 2022).
Figure 6 illustrates the realized net profit and loss, which is calculated by comparing the prices of all moved coins based on the difference between the price at their last movement and the current movement. This metric helps understand when investors take profits or capitulate.
Historically, as shown in Figure 6, after each cycle’s peak, BTC price experienced a decline, leading to short-term investors selling at a loss until the point of final capitulation. Conversely, most profits were taken when the market was highly hyped. Focusing on the most recent cycle, BTC reached its peak in November 2021 at approximately $69K and subsequently dropped by around 78% to the November 2022 low of $15.5K. During this period, the crypto market faced several significant events, including the Luna crash, Celsius meltdown, FTX collapse, and Genesis default. One can infer that it is the falling price that triggers these liquidation events, rather than the events themselves causing the price decline.
The on-chain profit and loss data analysis provides insights into the behavior of investors during market cycles and highlights the significance of market sentiment and price movements. It helps in understanding when selling pressure reaches a peak and when buying pressure begins to outweigh it, indicating a potential bottom in the market.
Disclaimer: The information contained in this material is for informational purposes only and is not intended to provide professional, investment, or any other type of advice or recommendation, nor does it create a fiduciary relationship. TradeUP does not make any representation or warranty, express or implied, regarding the accuracy, reliability, completeness, appropriateness, or sufficiency of any information included in this material. Certain information may have been provided by third-party sources, and while believed to be reliable, it has not been independently verified by TradeUP. Any investment decision should not be made solely in reliance on this material, as the information is subject to change without notice. Securities and derivatives transactions involve the risk of loss, including loss of principal. Past performance is no guarantee of future results. It is important to carefully consider the potential benefits and risks involved before making any investment decisions.


Comments are closed.